
Example Models
to better understand ModelRisk
Duration of a project consisting of several inter-related tasks of uncertain duration
ModelRisk needs to be installed in order for the model to work.
An example of a Monte Carlo simulation risk analysis model for project risk management
Technical difficulty: 1
Model description
This is a typical project risk analysis problem. Let's imagine the following example: A construction company is about to sign a contract for building a hospital in the middle of the city. The government of the city wishes to know the estimate of the duration of the project for some planning purposes. In order to calculate the duration, the project manager has divided the project into several stages, and assigned the most likely values to the duration of each stage:
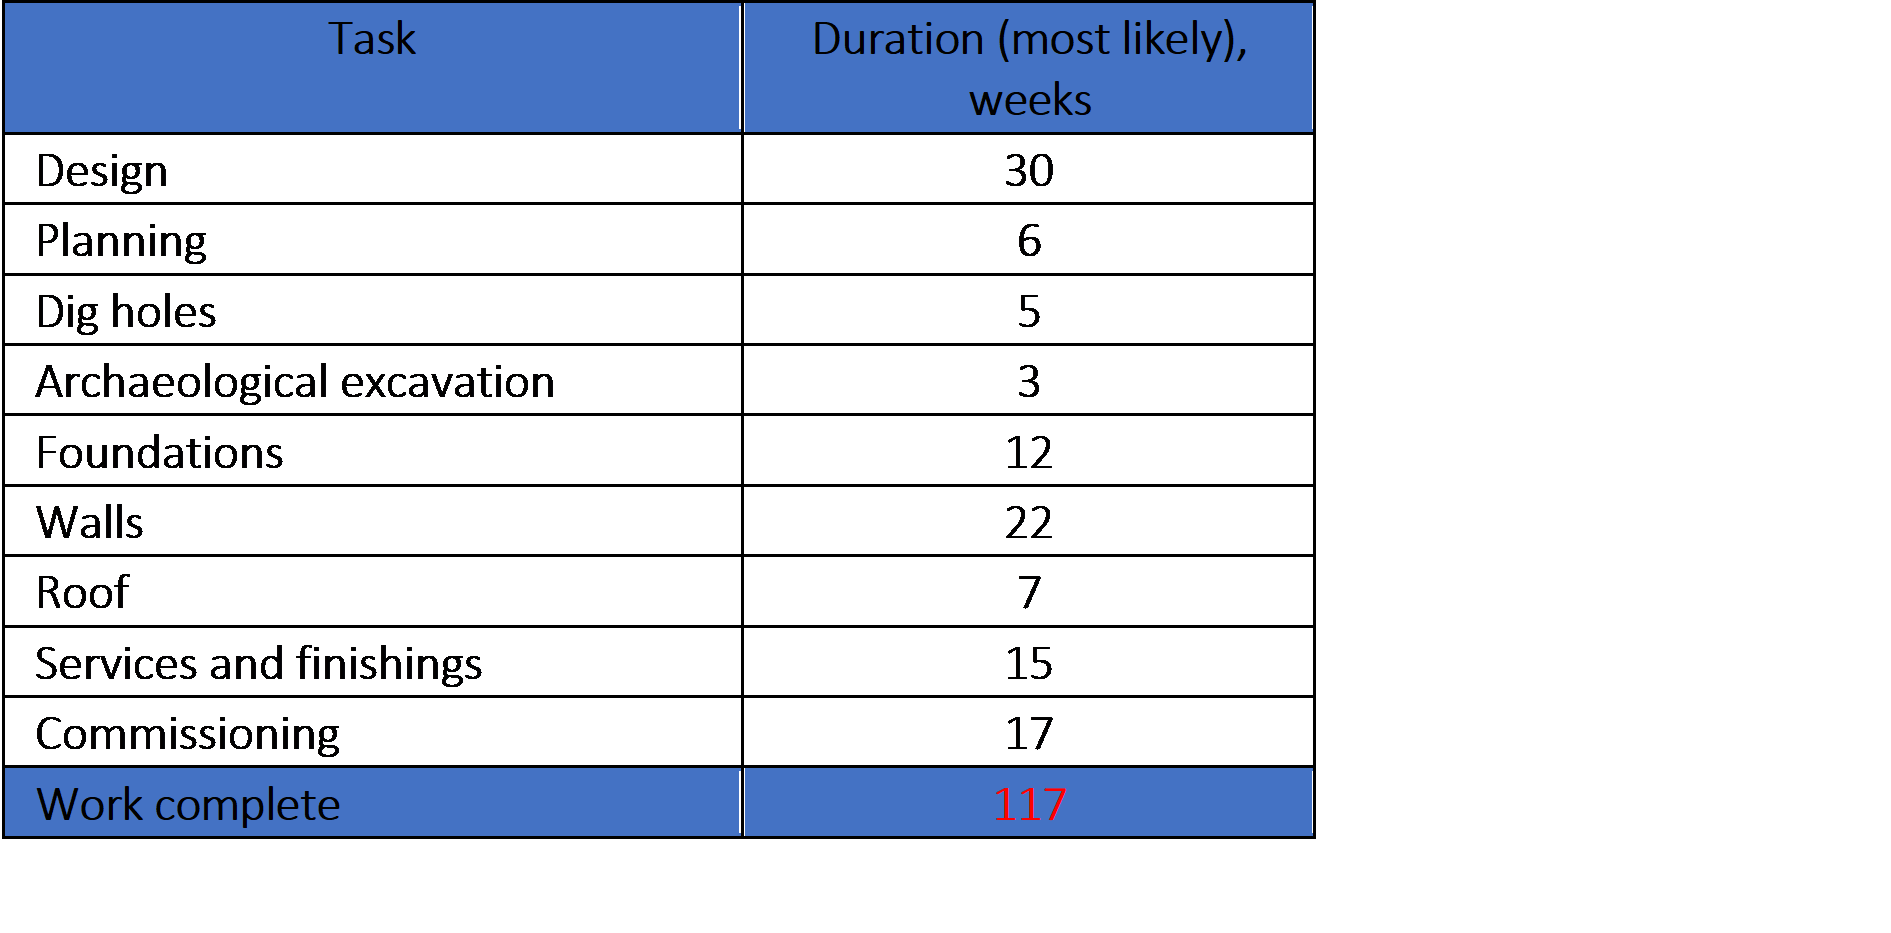 Each stage may start only after the previous one is finished and there are no parallel tasks. Thus, summing up the durations of all 9 stages, we get the total duration of the project equal to 117 weeks.
Now the project manager wishes to know the uncertainty around this parameter, as the input estimates are uncertain as well. He assigns the minimum, the most likely and the maximum possible values to the duration of each stage:
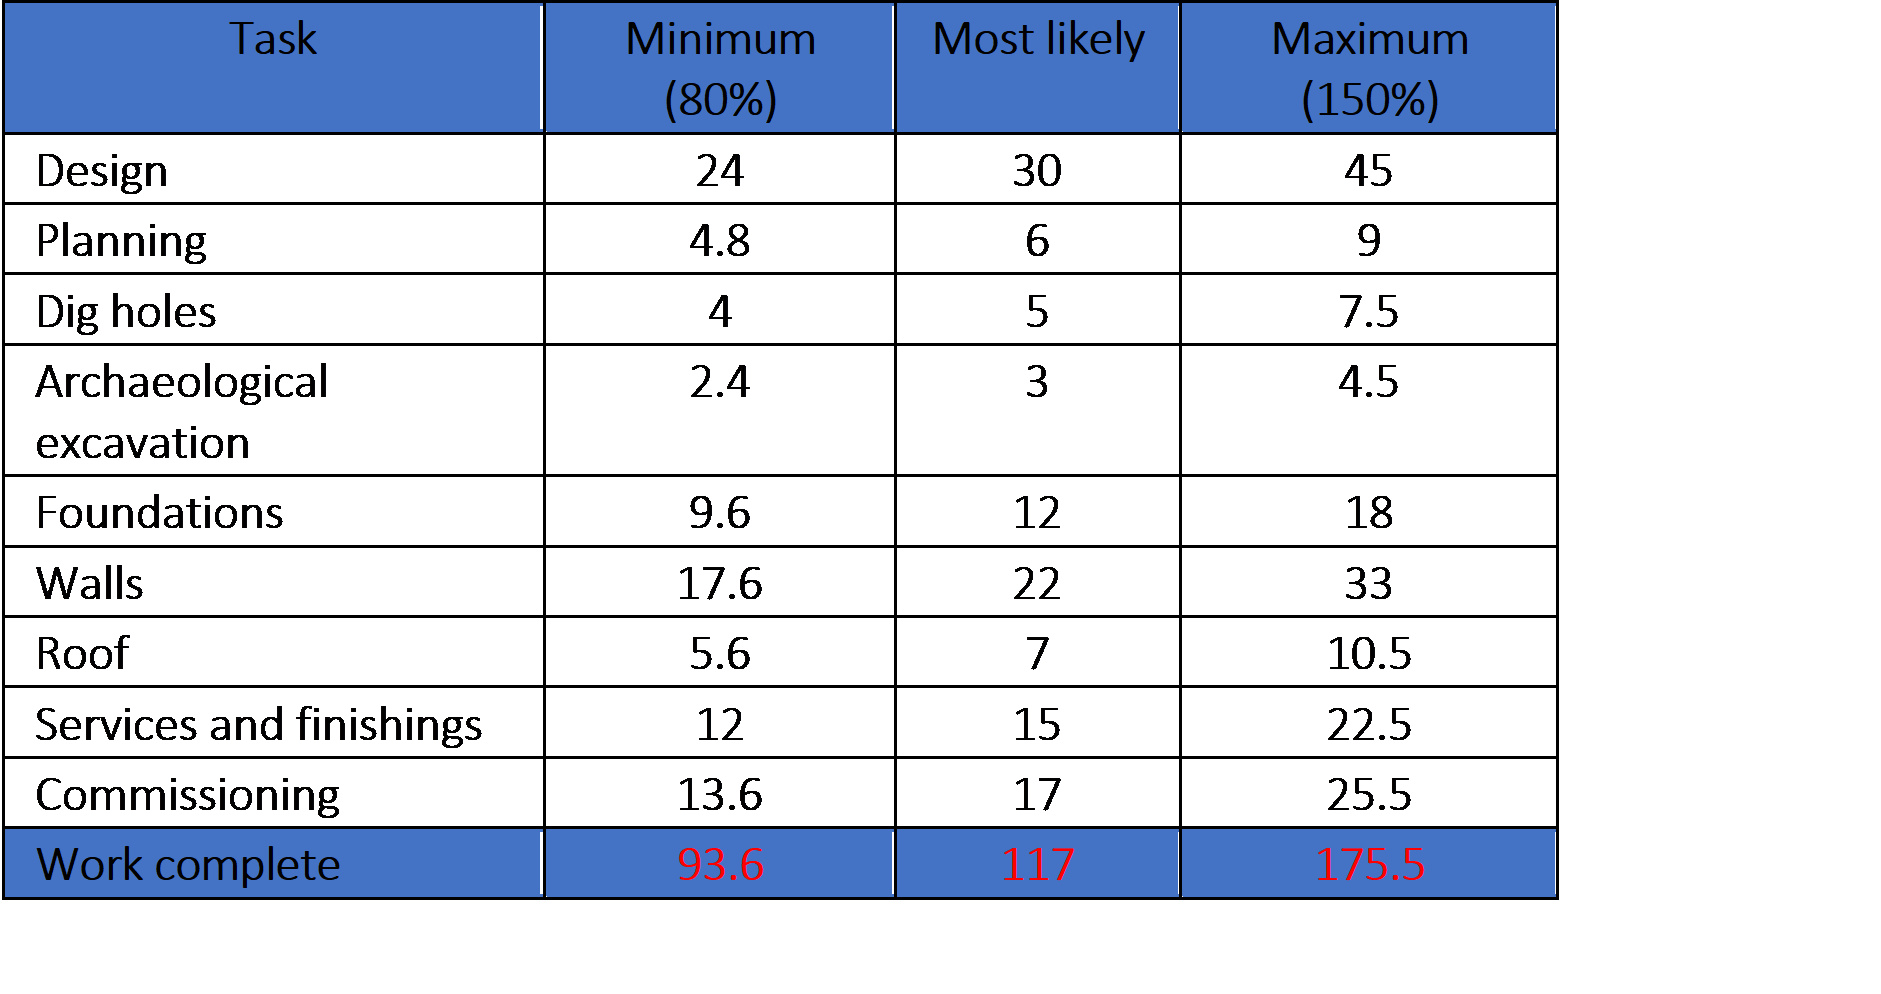 We have simplified thing here for illustration purposes by making the minimum and maximum value 80% and 150% of the most likely value respectively. In a real problem, the minimum and maximum would be estimated individually. In the most favorable scenario the total duration of the project will not be less than 93.6 week, and in the worst scenario case the duration will not exceed 175.5 weeks.
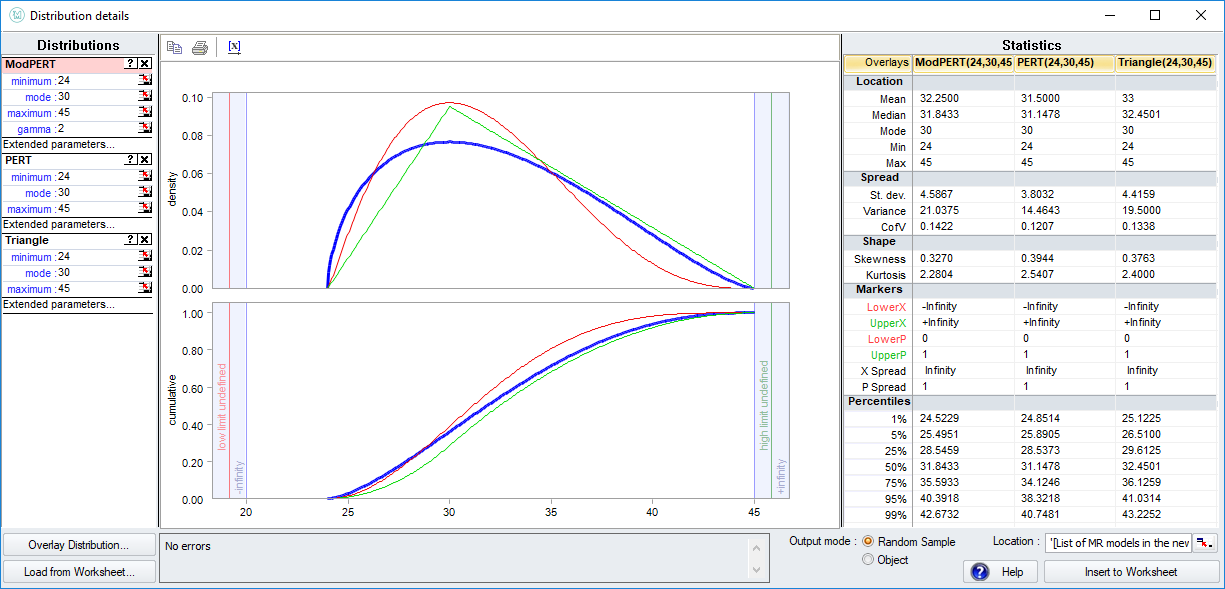
There are three widely used distributions that are applied in project risk analysis to model expert's opinions. These are the Triangle distribution, the PERT distribution, and the Modified PERT distribution. All of them take three parameters - minimum, most likely and maximum. Thus, the duration of each stage can be modelled by any of these distributions.
The figure below shows the three way of modelling the "Design" stage:
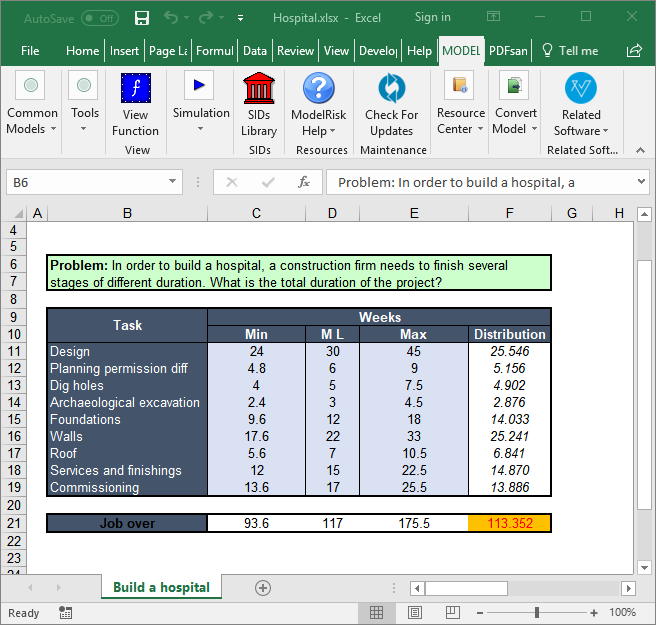
In general the Modified PERT with shape parameter gamma = 2 to 2.5 gives the best shape, but for this example, we will use the PERT distribution for all stages of the project as it gives a reasonable interpretation of these parameter values and is better known. Replacing the most likely values in the project manager's original calculations with distributions we get the structure as illustrated in spreadsheet model (1).
The outcome distribution for the total duration is shown below:
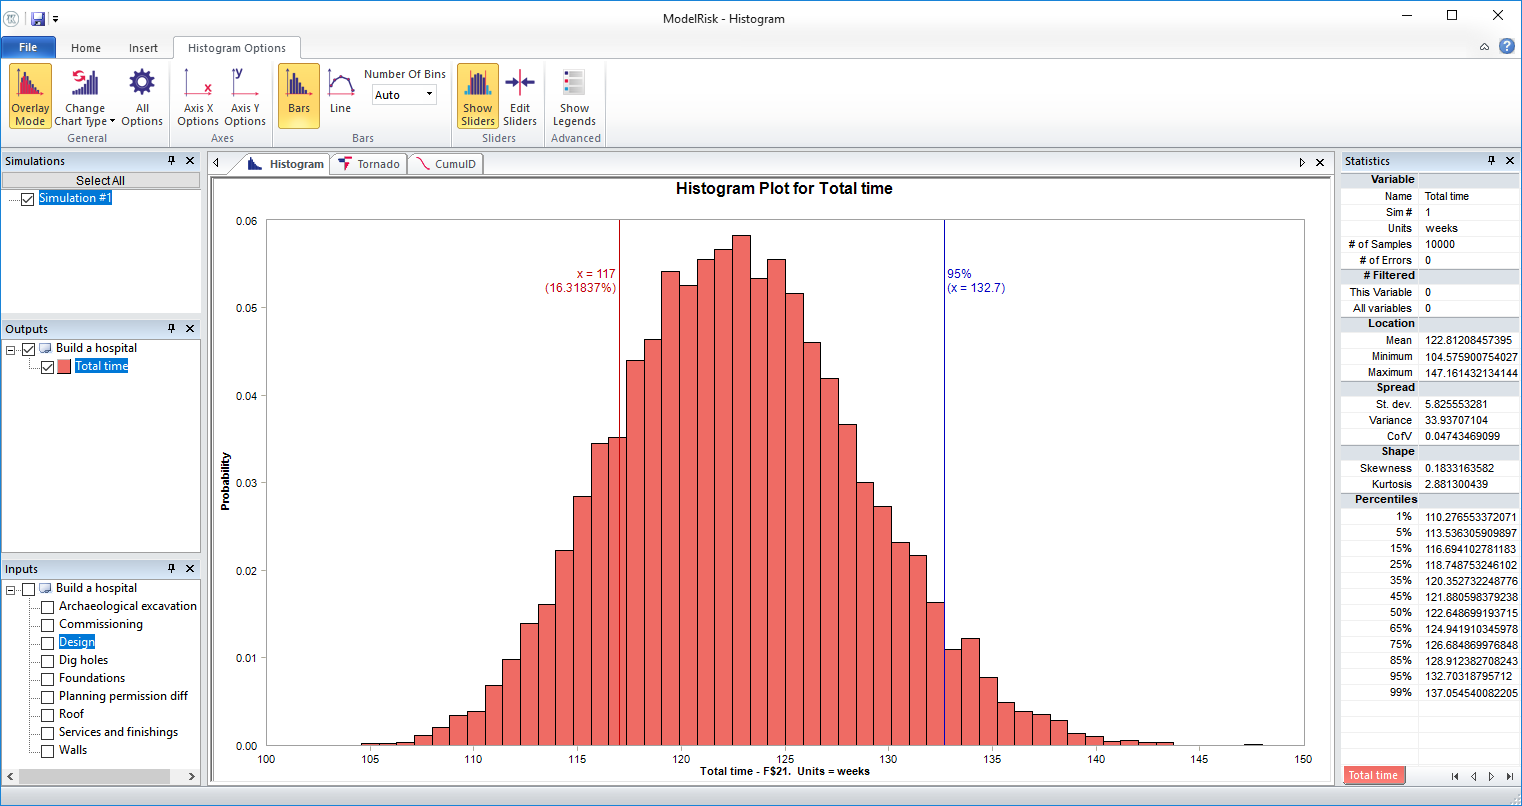
As we can see from this graph, the project manager's original estimate of 117 weeks is far from being the expected value. There is only a 16% probability that the total duration will be less than or equal to 117 weeks.
This is a very common problem for the project managers that try to estimate the duration of the project. By setting all their estimates to the most likely values they neglect the fact that usually the probability of exceeding the most likely value for a particular stage duration (or cost, in fact) is higher than finishing earlier, i.e. the distribution has a longer tail to the right because in a project there is an absolute minimum time, that any task will take, but life finds a way of introducing any number of obstacles to make that task take a very long time.
In this case we've had the minimum as 80% of the most likely and the maximum as 150% of the most likely, so we have a skewed distribution to the right for each of those tasks. As these distributions get added up, the difference between the most likely and the mean value of the sum becomes more and more large.
Generally, when you add a lot of probability distributions together, you get something that looks like a normal distribution (see Central Limit Theorem) with the 50th percentile of the Normal distribution pretty much equivalent to the sum of those mean values of the individual task distributions.
A rough rule of thumb would be to take the minimum plus 4 times the most likely plus the maximum divided by 6 for each of those tasks. That would give the mean of each of those PERT distributions and their summation would therefore give a rough approximation to the 50th percentile of the total project duration. If you were to use a Triangle distribution then it would be the minimum plus most likely plus maximum divide by 3.
Another example of this problem is described in the Silo model (2):
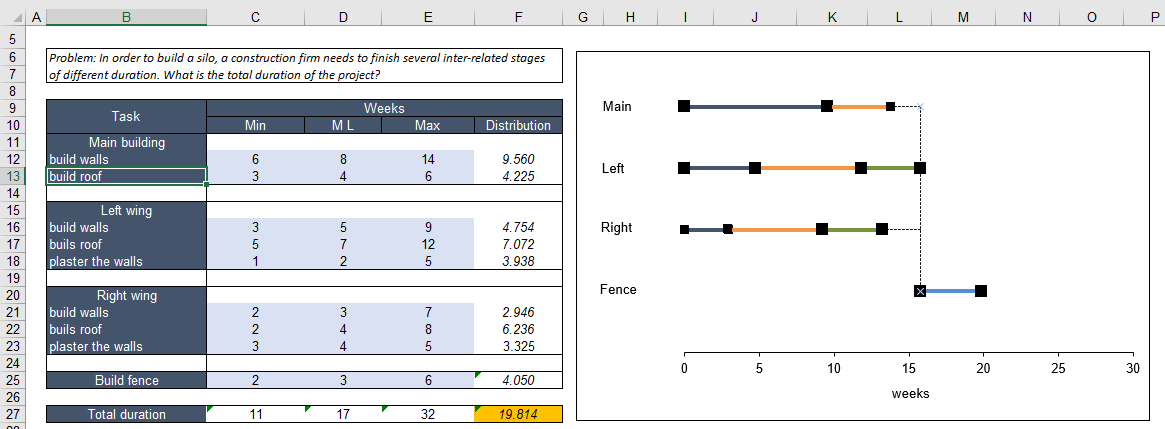
In this model we have tasks that are executed in parallel. The discrepancy between our best guess estimate and the actual mean of the distribution becomes greater and greater because when there are parallel tasks we are looking for the maximum duration of parallel path activities. This model is an extension to the previous one and it really shows at a very basic level why risk analysis for projects is very helpful.