Example Models
to better understand ModelRisk
Project schedule risk analysis
ModelRisk needs to be installed in order for the model to work.
An example of a Monte Carlo simulation risk analysis model for project risk management
Technical difficulty: 1
Model description
Schedule risk analysis uses the same principles as cost risk analysis for modelling general uncertainty and risks and opportunities. However, it must also cope with the added complexity of modelling the interrelationships between the various tasks of a project. The examples described here look at the simple building blocks that typically make up a schedule risk analysis and then shows how these elements are combined to produce a realistic model.
These examples are useful for understanding the basic ideas of project schedule risk analysis. However, for risk analysis of projects of any real level of complexity (say more than 30 tasks) it is advisable to use the Tamara software instead.
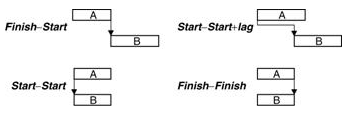
A project plan consists of a number of individual tasks. The start and finish dates of these tasks can be related in a number of ways:
- One task cannot start until another has finished (the link is called finish-start or F-S). This is the most common type of linking in project planning models.
- One task cannot start until another task has started (start-start or S-S).
- One task cannot start until another has been partially completed (start-start + lag or S-S + x);
- One task cannot finish until another has finished (finish-finish or F-F);
- One task cannot finish until another is a certain way from finishing too (finish-finish-lag or F-F-x).
The figure below shows how these interrelationships are represented diagrammatically:
In the rest of this topic we will use the notation '(a, b, c)' to denote a Triangle(a, b, c) distribution. So: Lag(5, 6, 7) wks is a lag modelled by a Triangle(5, 6, 7) distribution in units of weeks; Task 1(2, 4, 6) wks is a task (Task 1) with duration Triangle(2, 4, 6) distribution in units of weeks.
Example 1 – a simple schedule
This model is called Project_schedule_1 1: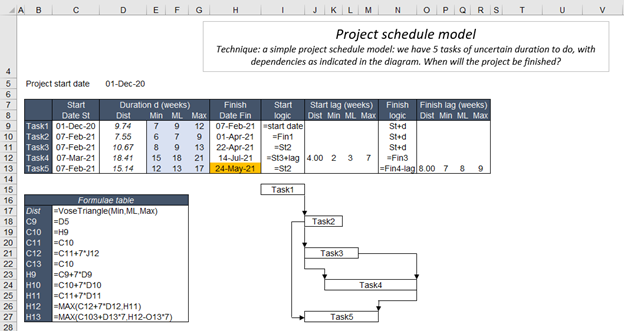
It is essential that a schedule risk model is set up to be as clear as possible, because it can easily become rather complex. The figure above illustrates a useful format, where all of the assumptions are immediately apparent. Note the use of MAX to determine the start date of a task dependent on a group of others finishing. Also note the *7 to convert between weeks and days.
Examples 2 and 3 – a simple schedule with risks
This model is called Project_schedule_2 2: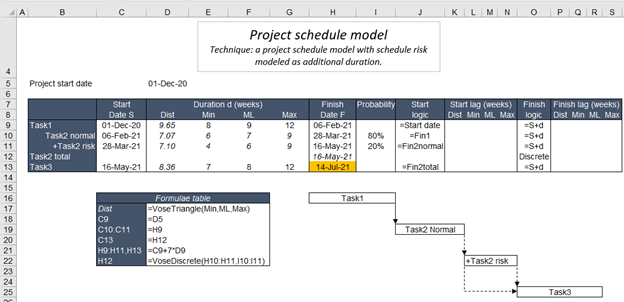
This model is called Project_schedule_3 3:
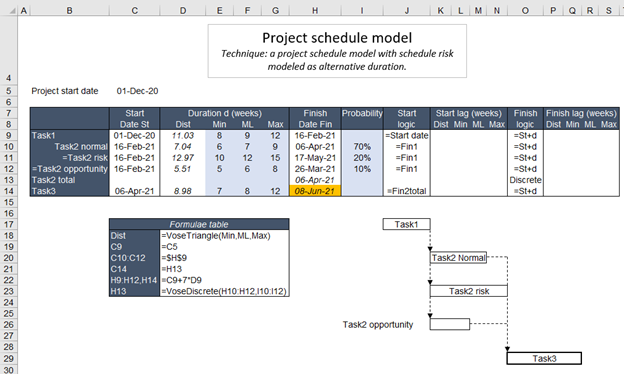
More complex relationships involving several tasks can now be constructed. So far, bold lines have been used to indicate the links between tasks. Dashed lines are now introduced to illustrate links that may or may not occur (i.e. risks and opportunities). Risks and opportunities can be modelled in two ways: by modelling the additional impact on the task's duration should the risk occur, as shown in Project Schedule 2, or by separately modelling the total durations of the task should the risk occur or not occur, as shown in Project Schedule 3. In Project Schedule 2, Task 2 is expected to take (6, 7, 9) weeks but there is a 20% chance of a problem occurring that would extend the task's duration by (4, 6, 9) weeks.
In Project Schedule 3, Task 2 is estimated to take (6, 7, 9) weeks but there is a 20% chance that a particular risk will increase its duration to (10, 12, 15): there is also an opportunity, with about a 10% chance of occurring, that would reduce the duration to (5, 6, 8). The start of Task 3 is equal to a Discrete distribution of the finish dates of Task 2's possible scenarios.
Example 4 – a simple schedule with inter-related risks
This model is called Schedule_model_with_risks 4: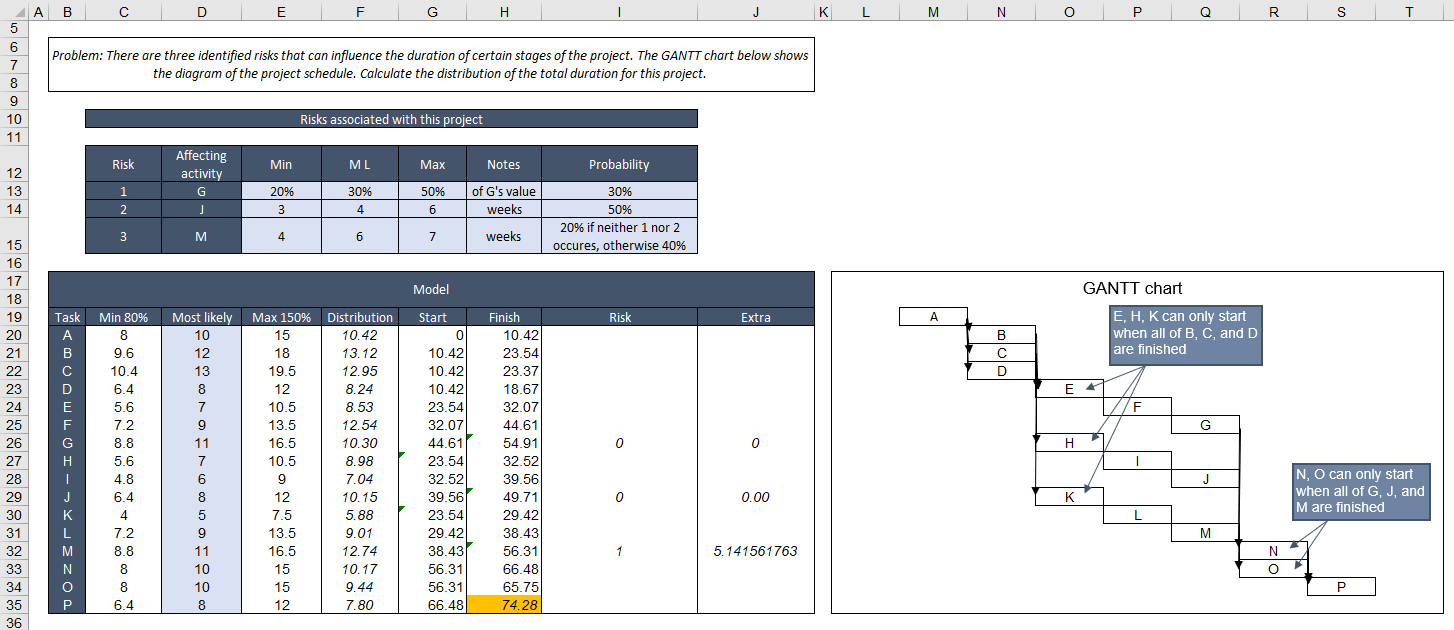
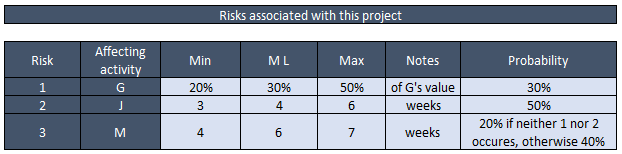
Stages B, C and D can only start after activity A is finished. Stages E, H and K can only start when all of B, C and D activities are finished. Stages N and O can only start when all of G, J and M activities are finished. Stage P can only start when both N and O activities are finished.
There are three risks that can influence the duration of certain stages as summarised below: